Answer a Quick Question
Overview
Have you ever received data and just wanted to answer some quick questions about it on-the-fly?
Doing a full data analysis and creating a report or dashboard takes a lot of time and is often overkill if you just want to gain some quick insights. With the AgileData App it is possible to upload your data and answer a question about it in only a few minutes. Here’s how you can do it:
Upload a CSV file into AgileData
Auto create the AgileData rules
Ask a question about your data
AgileData automatically profiles the uploaded data, generates rules for further processing and lets you seamlessly load the data in Looker Studio where you can create charts and visualisations. In addition, you can visually explore the data and use a ChatGPT-like feature to ask questions about the data in plain English.
Steps
1. Uploading your data as a CSV file
To get started, you need to upload your data as a CSV, JSON or xls file.
Open the AgileData App and click on the “Collect” menu. Choose the “Upload Files” option.

Drop the CSV file with the data you want to analyse. You can upload CSV files from your local machine or from Dropbox and other forms of cloud storage. In this guide we’re going to explore data about business grant recipients in New Zealand.

If the upload was successful, you will get shown a success message. Click on “Go To Catalog” to continue with exploring the uploaded data.

2. Landing Tile and History Tile get created
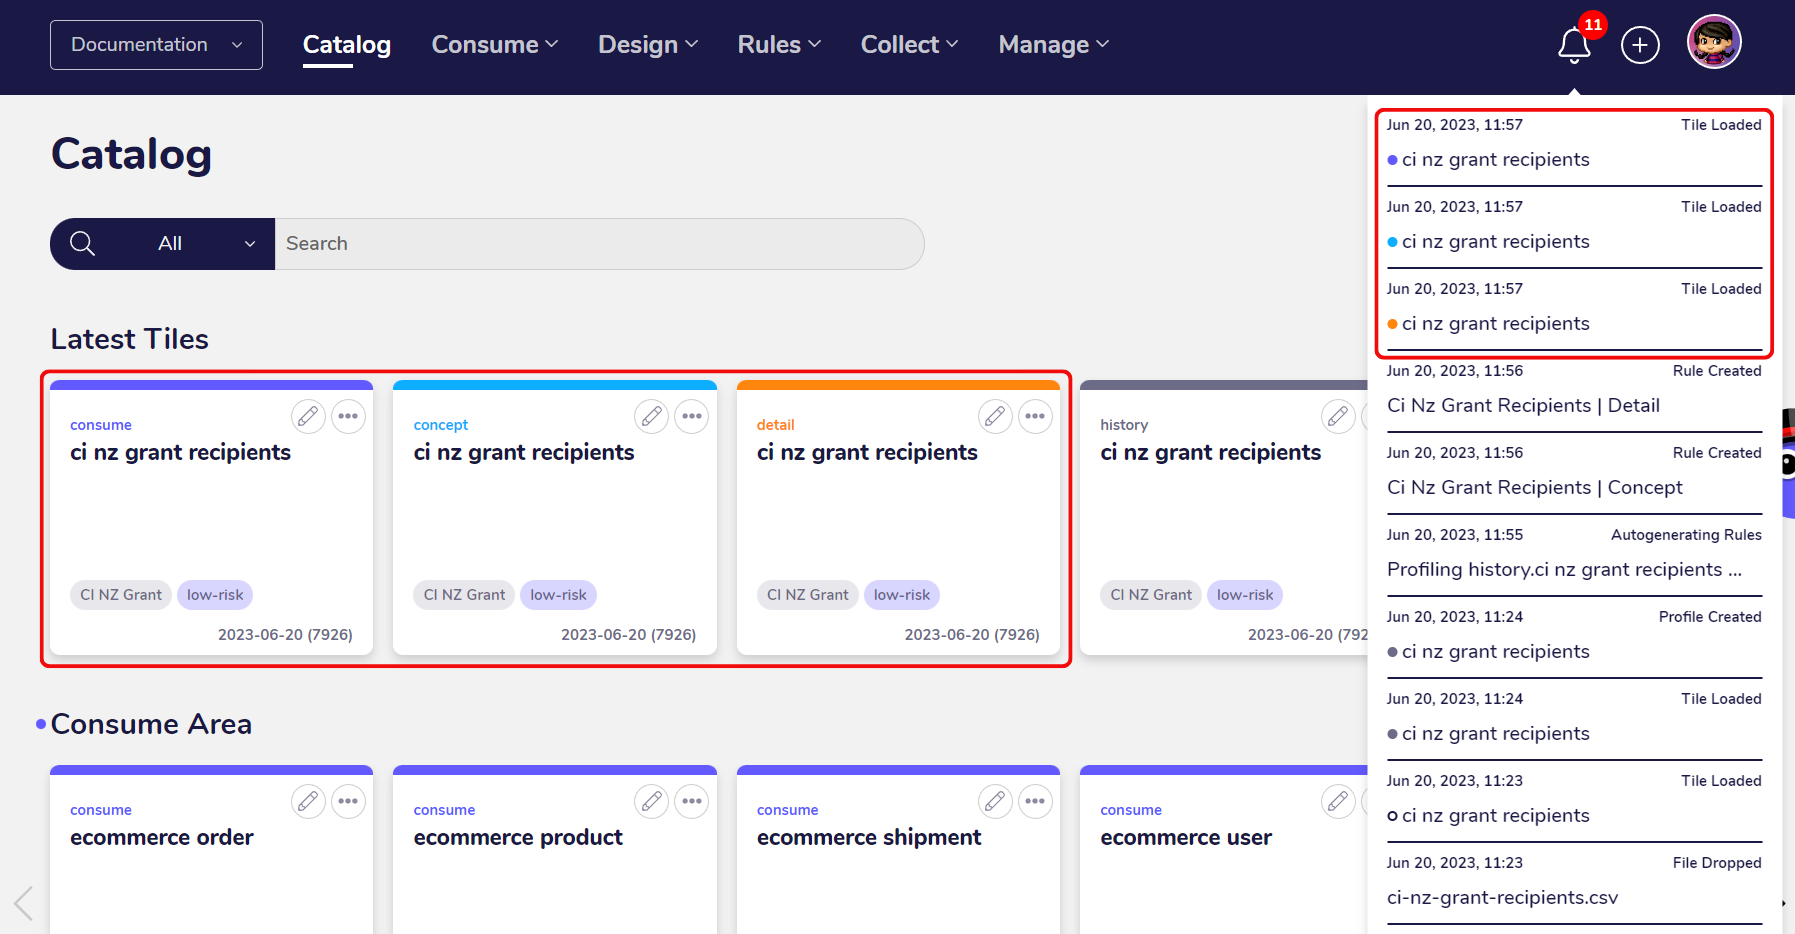
After the upload, AgileData automatically transforms the data into a landing tile by parsing and profiling the data. You can find the landing tile in the catalog alongside the notifications at the top.

Afterwards, the landing tile gets transformed into a history tile. History tiles are immutable records of your organisations data and store the data permanently.

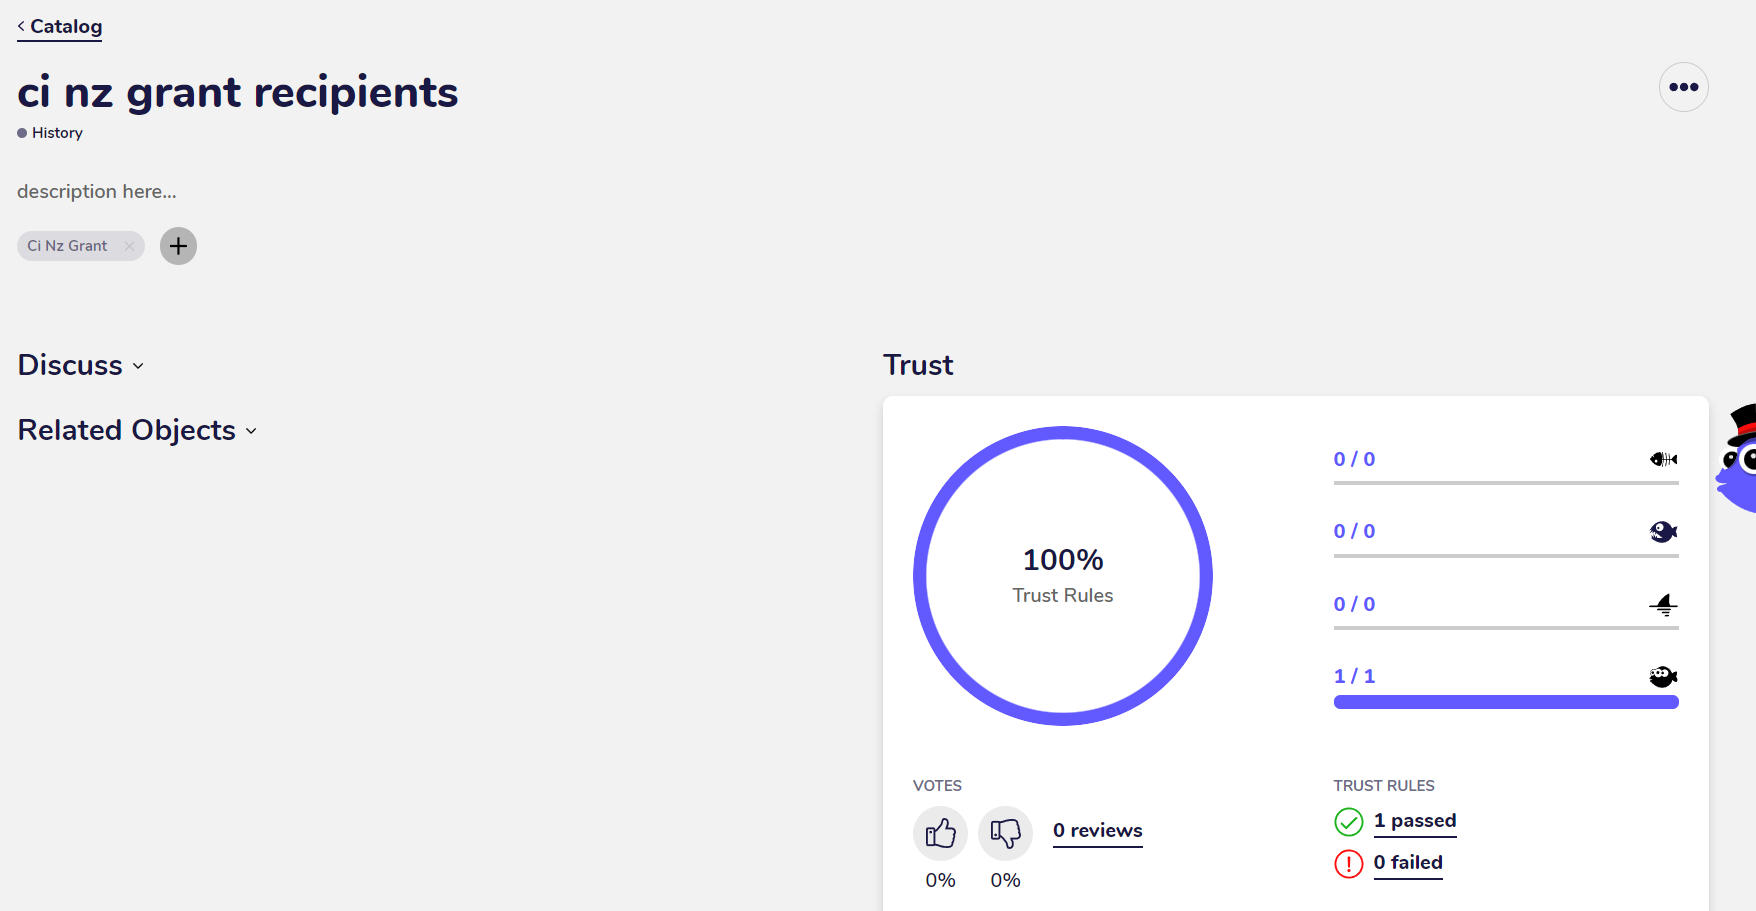
Upon clicking on the history tile, you can see that AgileData automatically created a first set of trust rules to provide an overview of the data, although the business context is still missing.
3. Auto-Generate Rules and create Consume Tile
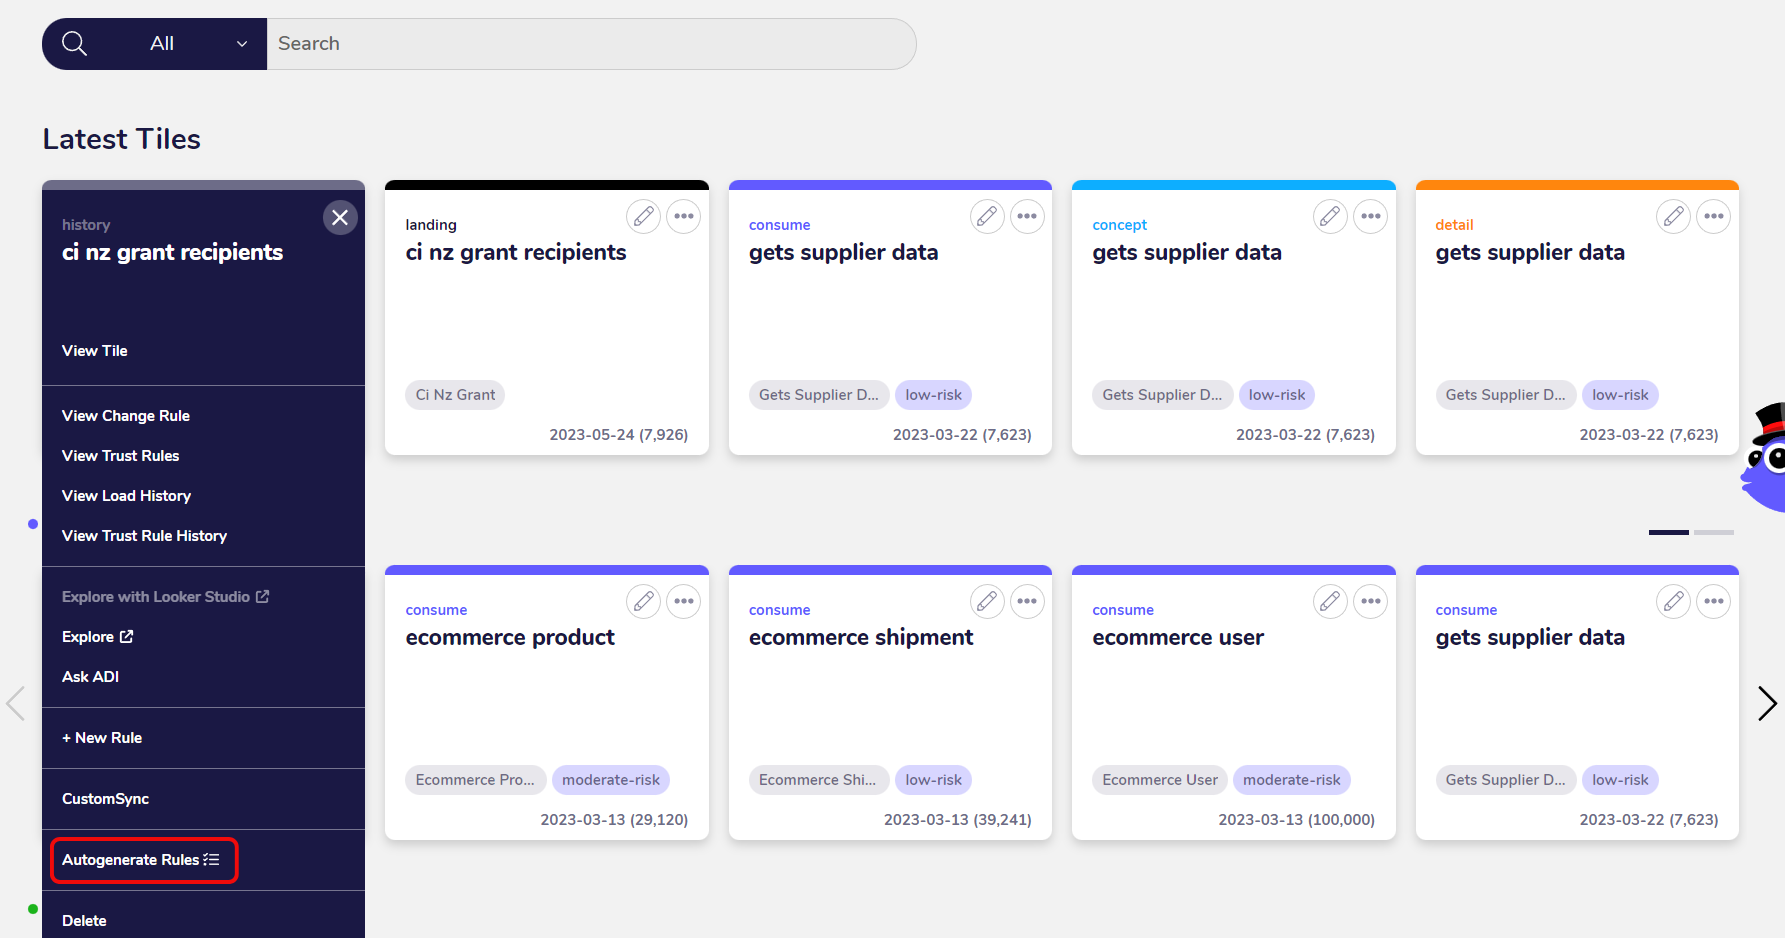
To be able to query the information you need to generate further rules and create a Consume Tile. This can be done automagically by clicking on the three dots at the top of the History Tile and on “Auto-Generate Rules” in the popup menu.
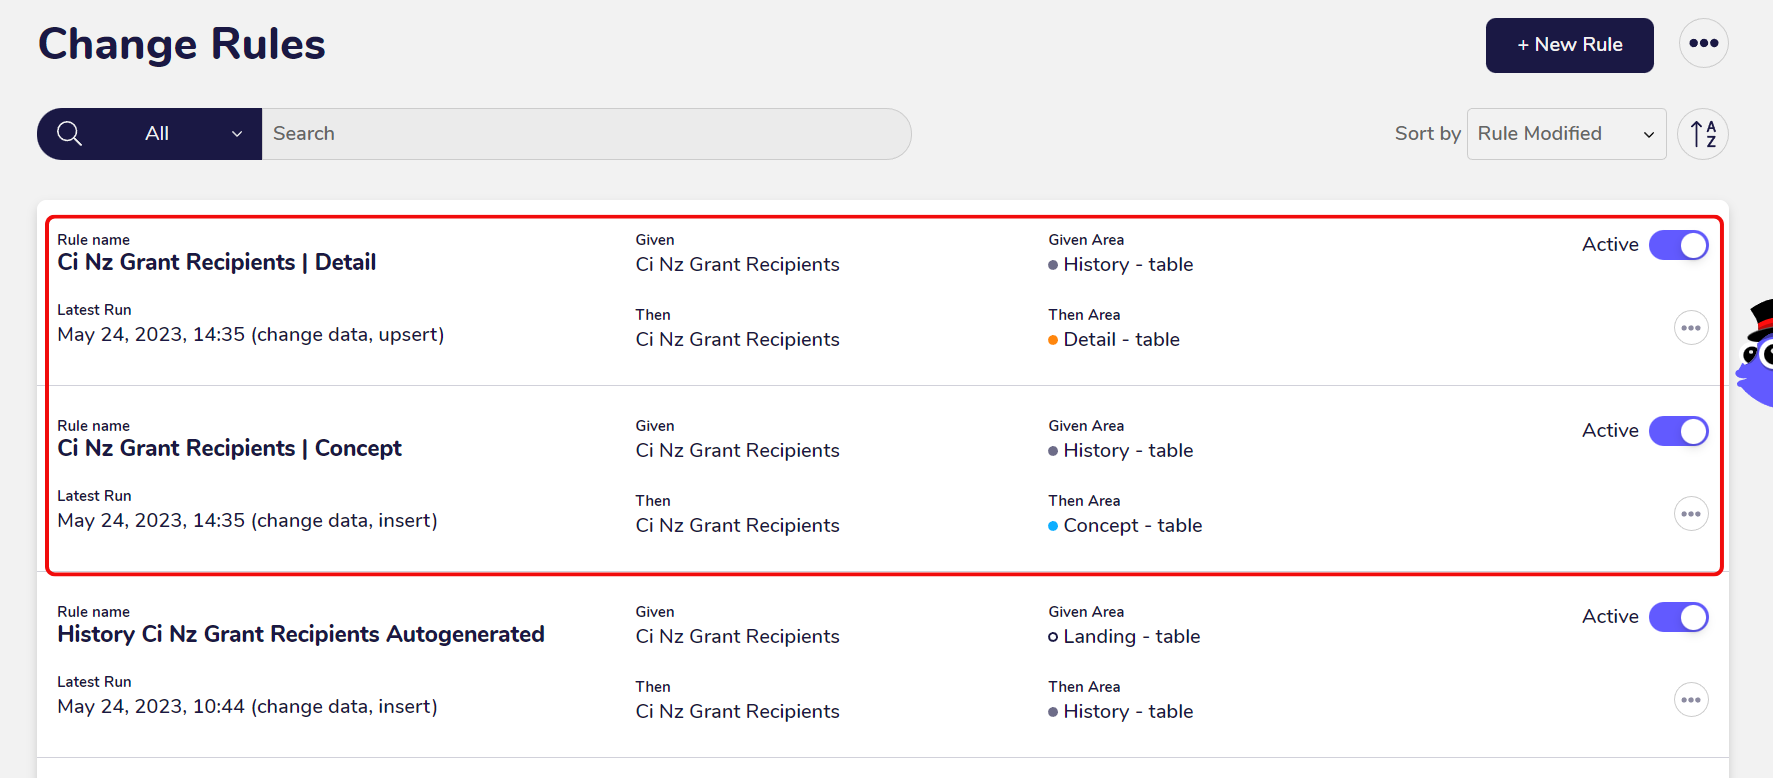
A detail and a concept rule will get created based on the data.

You can view these rules if you navigate to the “Change Rules” menu option which can get accessed by clicking on the “Rules” menu.

The rules will get run and a Consume Tile will get created. This process might take a few seconds. The Consume Tile contains the data which is ready to get explored.
4. Report on the data with Looker Studio
If you quickly want to create a report, a dashboard or some data visualizations, you can directly open the data in Looker Studio by clicking on the three dots in the top corner of the Consume Tile and then on “Explore with Looker Studio”.
Looker Studio is a data analytics environment provided by Google which enables users to create and share interactive reports, dashboards, and visualizations with an easy drag-and-drop interface.

5. Explore the data with Google Facets Dive
If you want to explore the data in a visual way, you can open it with Google Facets Dive by clicking on the three dots in the top corner of the Consume Tile and then on “Explore”.

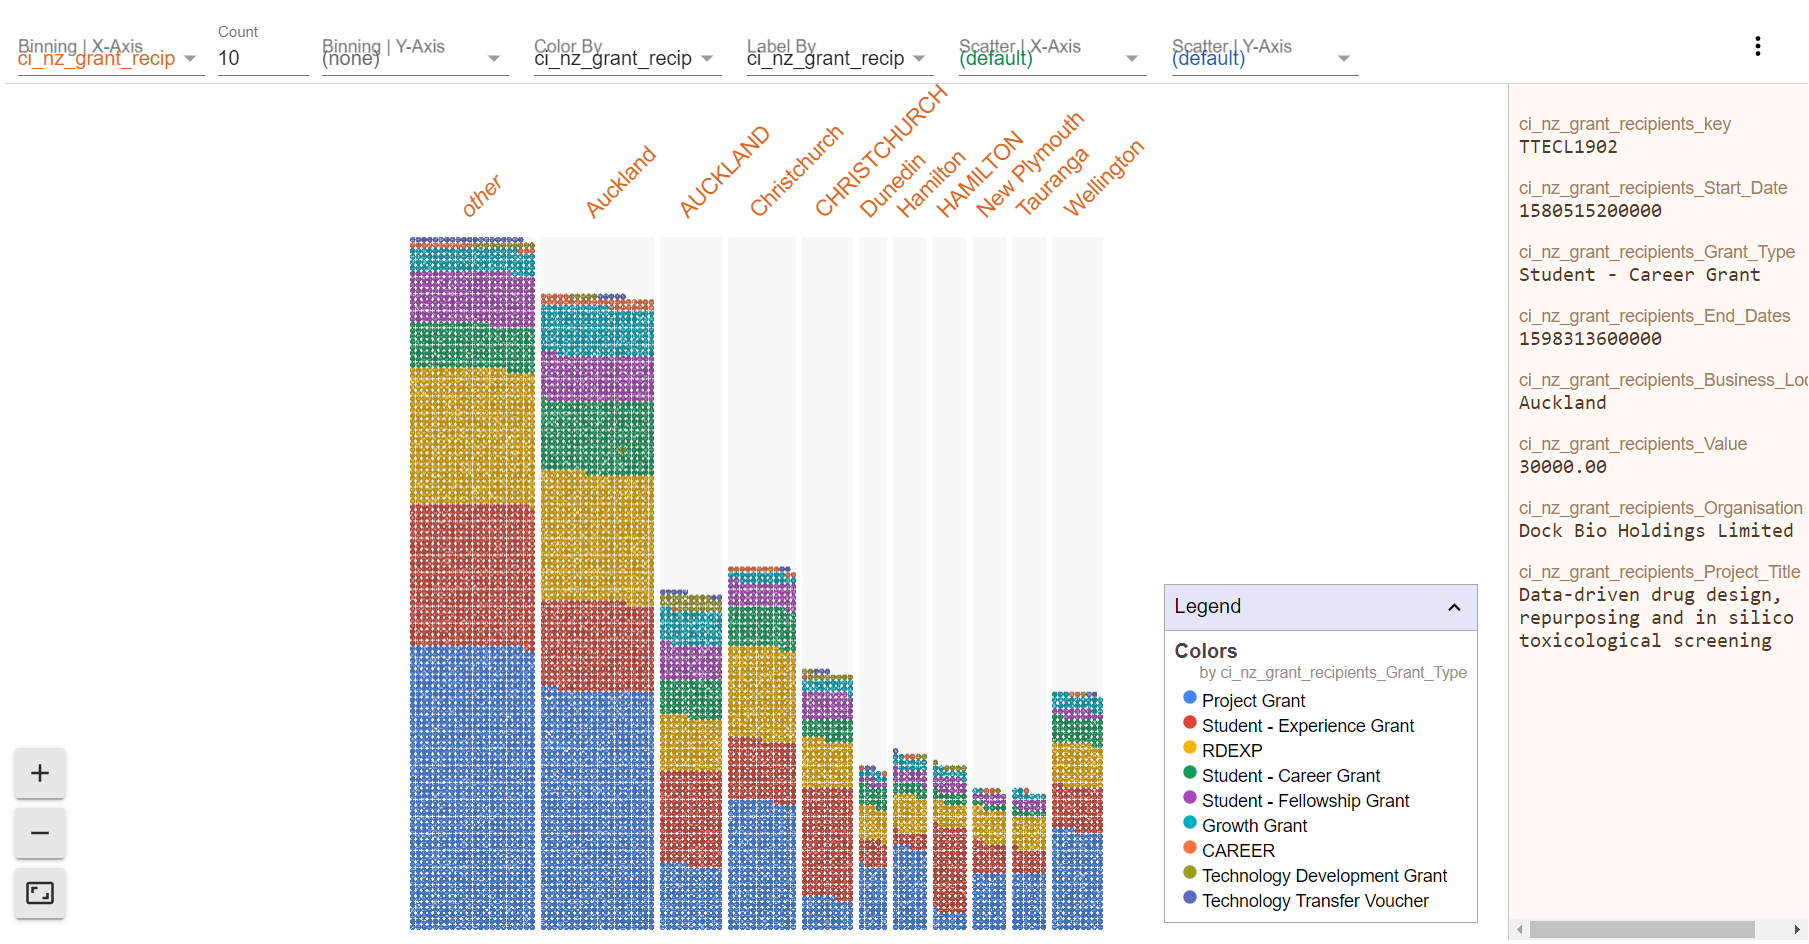
Google Facets Dive is an open-source tool developed by Google’s People + AI Research (PAIR) team for the exploration and analysis of large-scale, high-dimensional data. The tool offers a scatterplot-based visualisation, where each data point is represented as a dot on the plot. For the data in an AgileData tile this means one dot corresponds with one row or record.
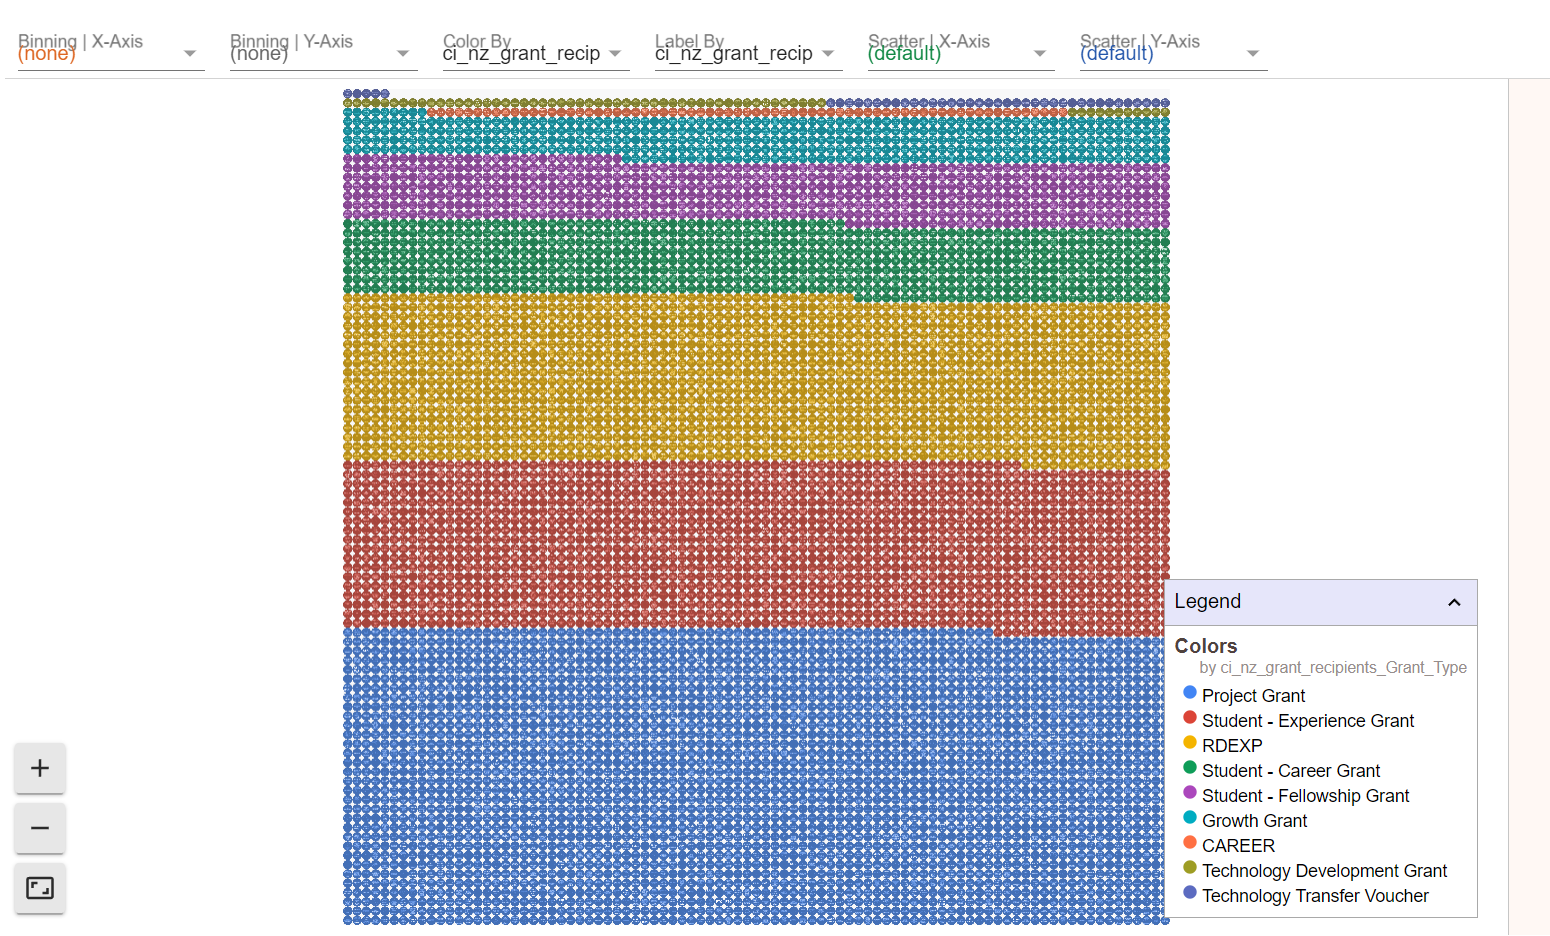
You can interact with the plot by zooming, panning, and selecting specific data points to examine their properties and values. By clicking on a singular dot you can view the associated record. You also can for example visualise the data based on specific fields values such as business locations in New Zealand.
6. Answer quick questions with Ask ADI
The last feature to explore the data is “Ask ADI” which enables you to ask questions in plain English about the data by utilising a connection to ChatGPT. You can access the feature by clicking on the three dots in the top corner of the Consume Tile and then on “Ask ADI”.

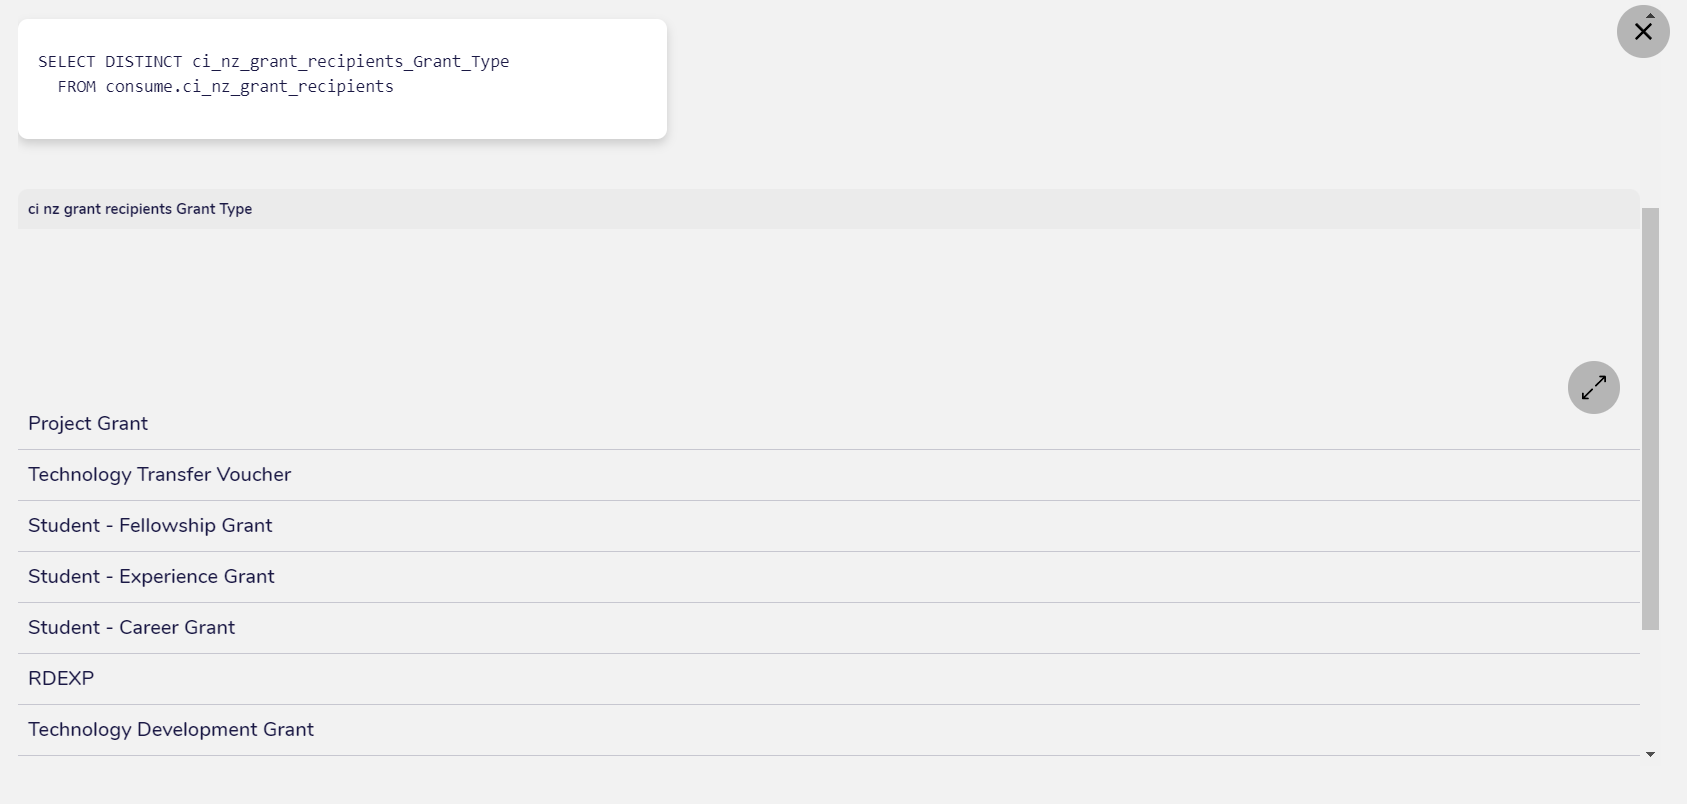
Type your question into the search bar, for example “grant types” to ask which different grant types occur among all records.
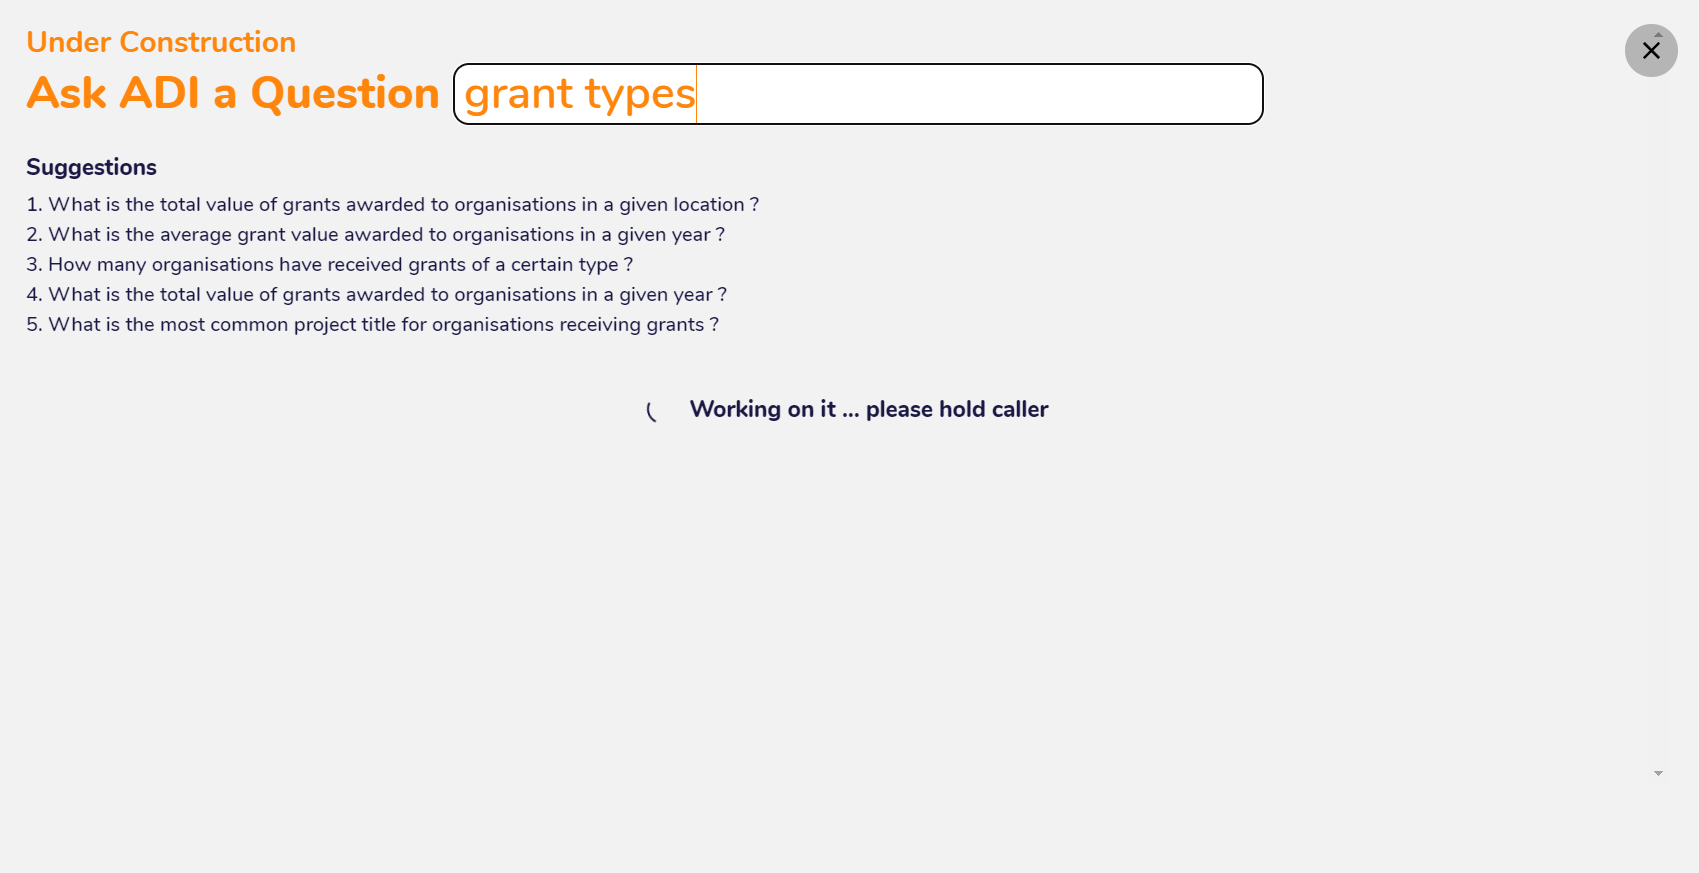
The search question gets sent to ChatGPT as plain english and transformed into an SQL query by ChatGPT, which we then run in AgileData and return your data results. Your data is not sent to ChatGPT, it remains in AgileData. You can immediately view the results below the search bar, gaining quick insights into the data without having to conduct an SQL analysis by yourself.
Use Cases
Of course it is important to conduct the full process of data design and data validation if you are writing a report or creating a dashboard. But in certain use cases the feature “Answer A Quick Question” can remove friction in your daily work as a data analyst or consultant.
1. Answering quick questions for a client
If you’re a data consultant, you have likely encountered the situation of facing last-minute questions by your clients. Or perhaps you even notice that you’re lacking crucial insights in the middle of the call.
How to deal with these situations?
The “Answer A Quick Question” feature can help you with answering such questions on-the-fly, even if you are preoccupied with something else. By using the ChatGPT integration you can profile the data and ask your questions within minutes, completely without having to create a database and write SQL queries.
Data consulting is a dynamic work environment and by using “Answer A Quick Question” you can keep pace while having to rapidly analyse new data.
2. Exploratory Data Analysis (EDA)
While conducting an EDA the “Answer A Quick Question” feature can be very useful for automatically profiling the data and exploring the data in different settings such as visually with Google Facets Dive or with questions via Ask ADI.
This can help with getting a quick overview of the data and its main features, getting an insight into the data and its context and with identifying potential issues like NULL values or mislabeled fields.
The process of EDA can be time-consuming and feel like a search in the dark for many data analysts. With AgileData’s powerful features for data exploration you can get a grasp on a new data without even having to open a Jupyter Notebook.
Optional Steps
1. Automatically create rules by configuring Tenancy Features
The process of making the data ready to consume can get sped up by configuring the Tenancy to automatically create rules for the Concept and Detail tiles after uploading the data. This means you jump over the step of having to manually click on “Auto-Generate Rules” on the History Tile. Instead, the process goes immediately from uploading the data to delivering the finished Consume Tile.
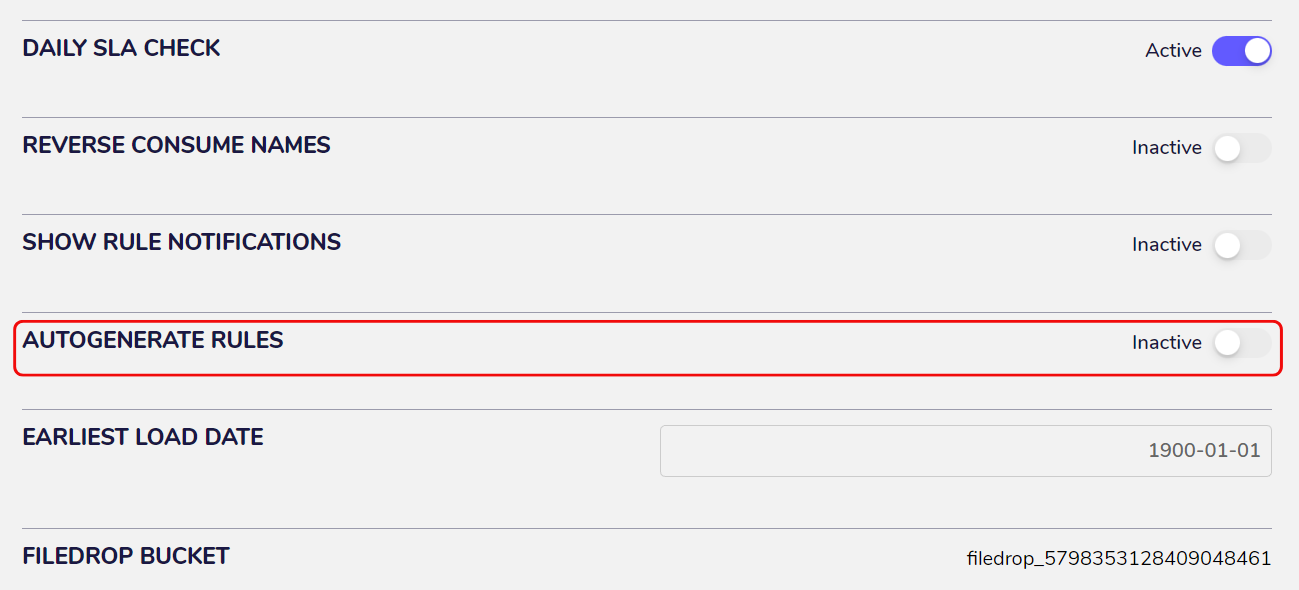
You can configure this option under “Tenancy Features” after clicking on the “Manage” menu.

Set the field “Autogenerate Rules” to “Active” to activate this option.