Looker Studio
Overview
Would you like to explore your data from your AgileData Tenancy in the Looker Studio visualisation tool?
By connecting Looker Studio to AgileData it is possible to directly design reports based on the data in your Consume Tiles.
Looker Studio, formerly known as Google Data Studio, is a popular cloud reporting tool provided by Google for creating reports and dashboards based on uploaded or connected data. You can connect a variety of different data sources to Looker Studio, and AgileData is one of those options.
Establishing a direct connection between AgileData and Looker Studio can help you to streamline your workflow as a data analyst or consultant. For example, you can first create rules for your data in the AgileData App and then head over to Looker Studio for data exploration and visualisation.
There is also the option to open Looker Studio from within the AgileData App by clicking on the three dots at the top of a tile and selecting “Explore with Looker Studio”.
In this guide however we are covering the process of connecting data to the Consume Tiles in your AgileData catalog in Looker Studio itself.
Steps
1. Open Looker Studio
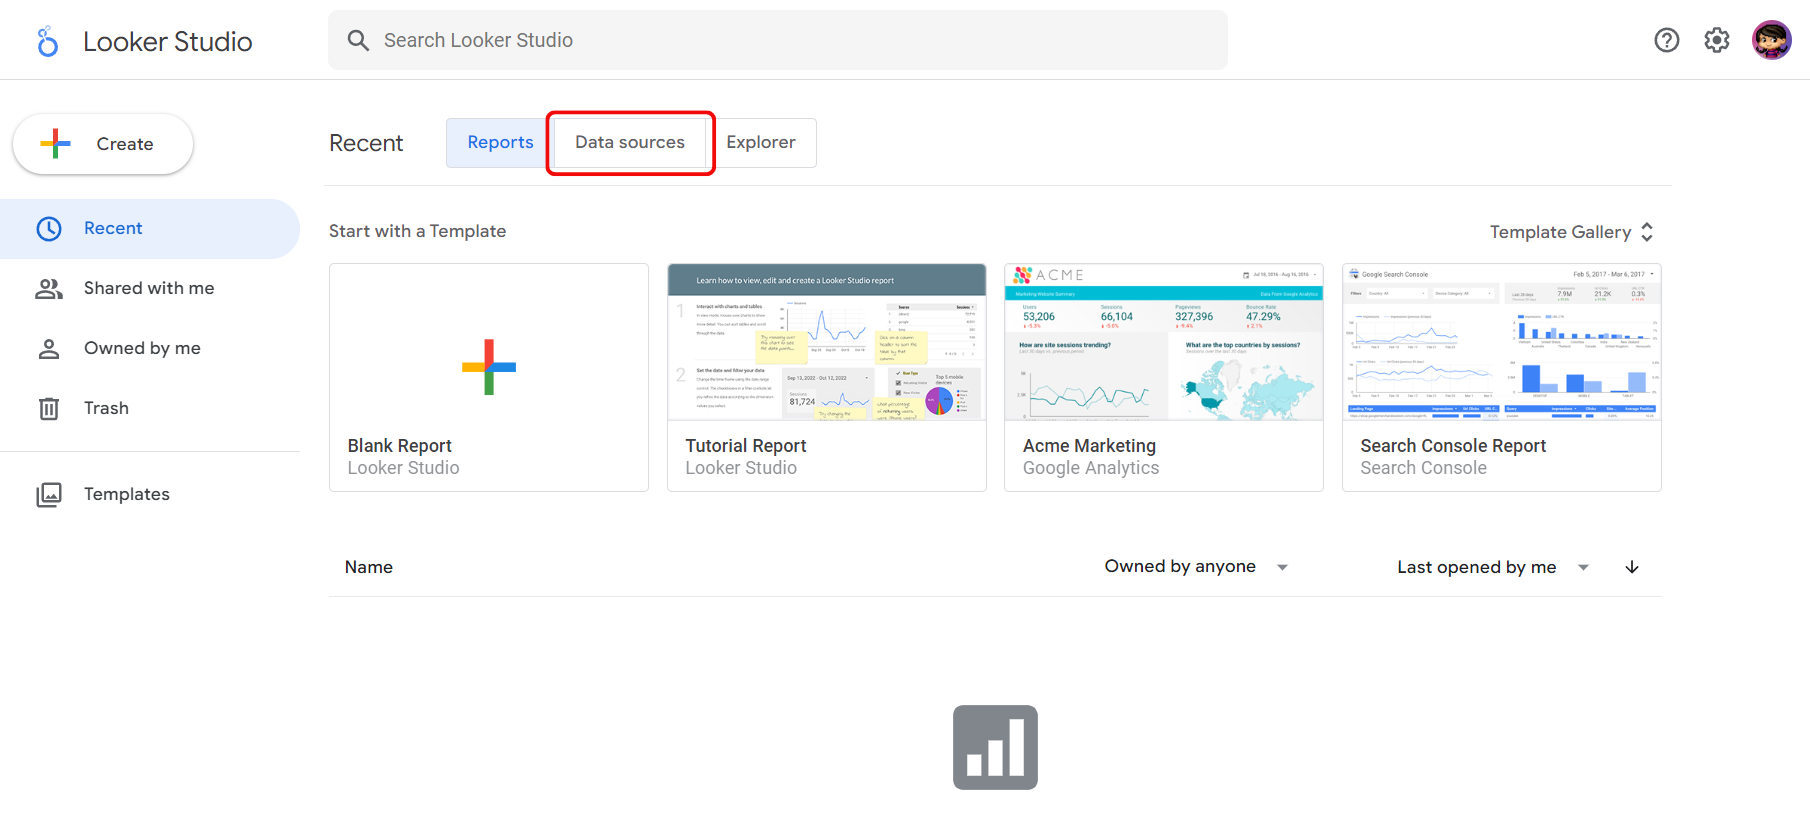
To get started, open Looker Studio. You’ll see an interface with your previously created reports or dashboards.

2. Go to the “Data Sources” panel
Click on “Data Sources” in the menu above the reports screen. You will get taken to the Data Sources panel where you can view all of your data connections.
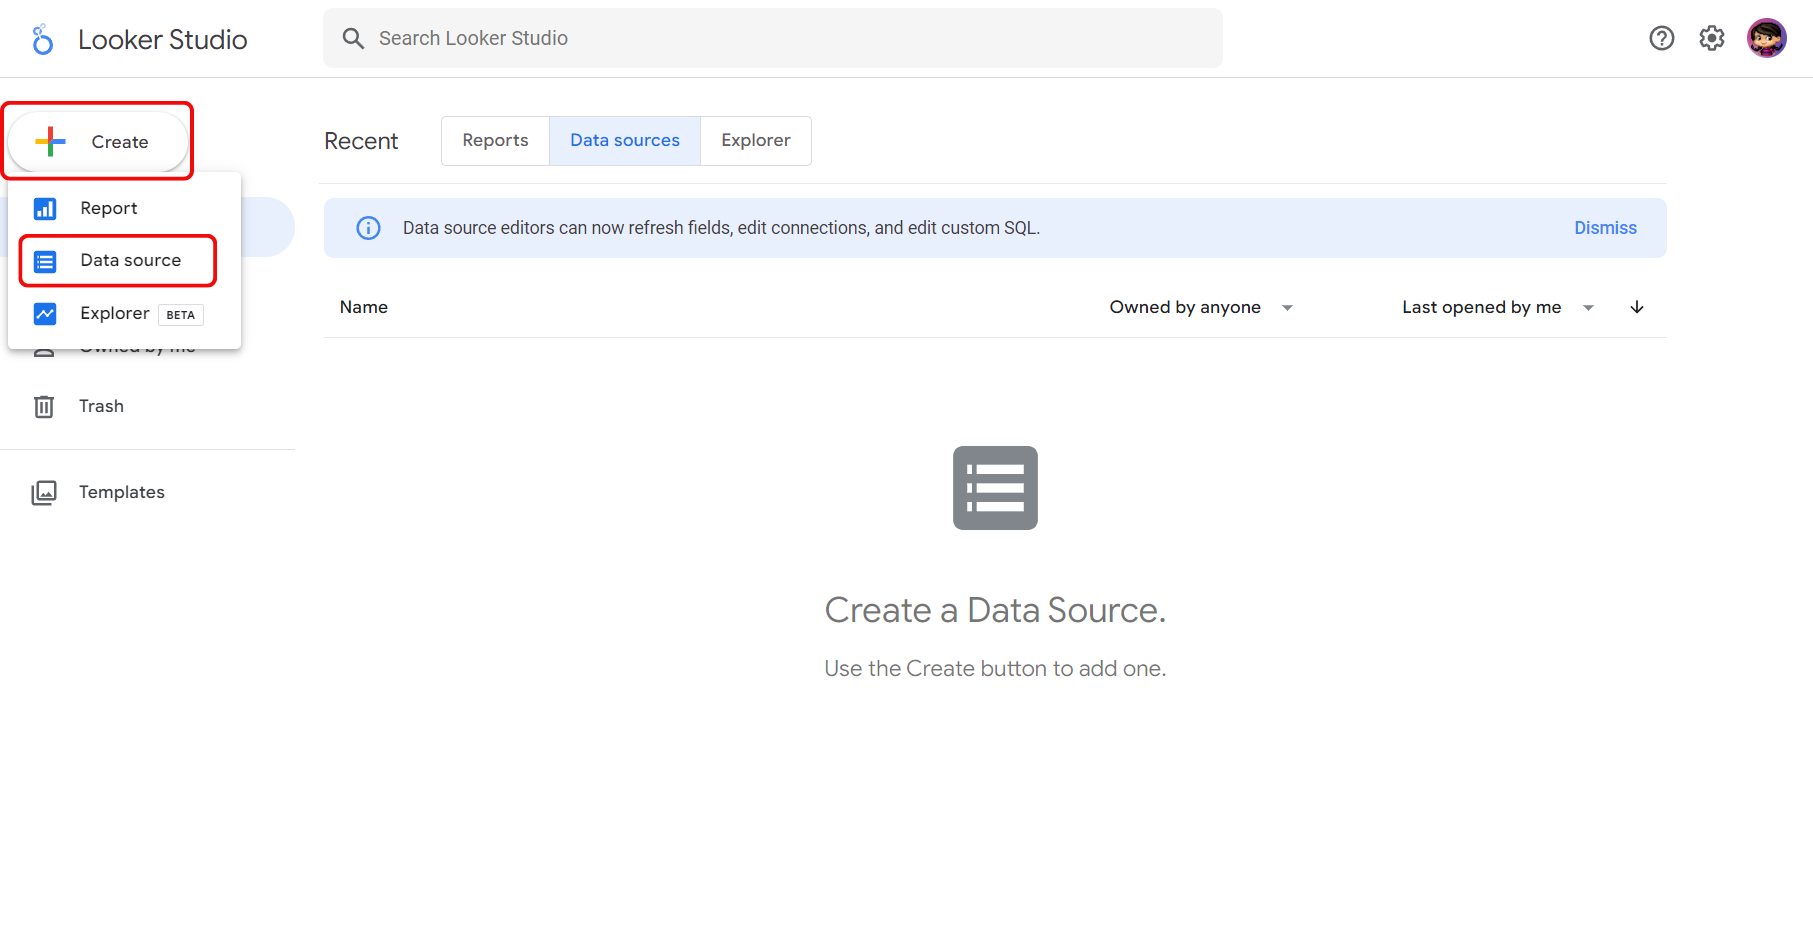
3. Create a new BigQuery connection
In the Data Sources panel click on the “Create” button and then on “Data sources” in the dropdown menu.
To connect to the AgileData App you will use BigQuery.
BigQuery is a powerful cloud analytics database provided by Google Cloud. It is designed to handle large-scale datasets and allows organisations to store, analyse, and query vast amounts of data in a fast and efficient manner. AgileData uses BigQuery as part of the AgileData Platform.
Select “BigQuery” among the available data connectors.

4. Connect to a Consume Tile from the AgileData App
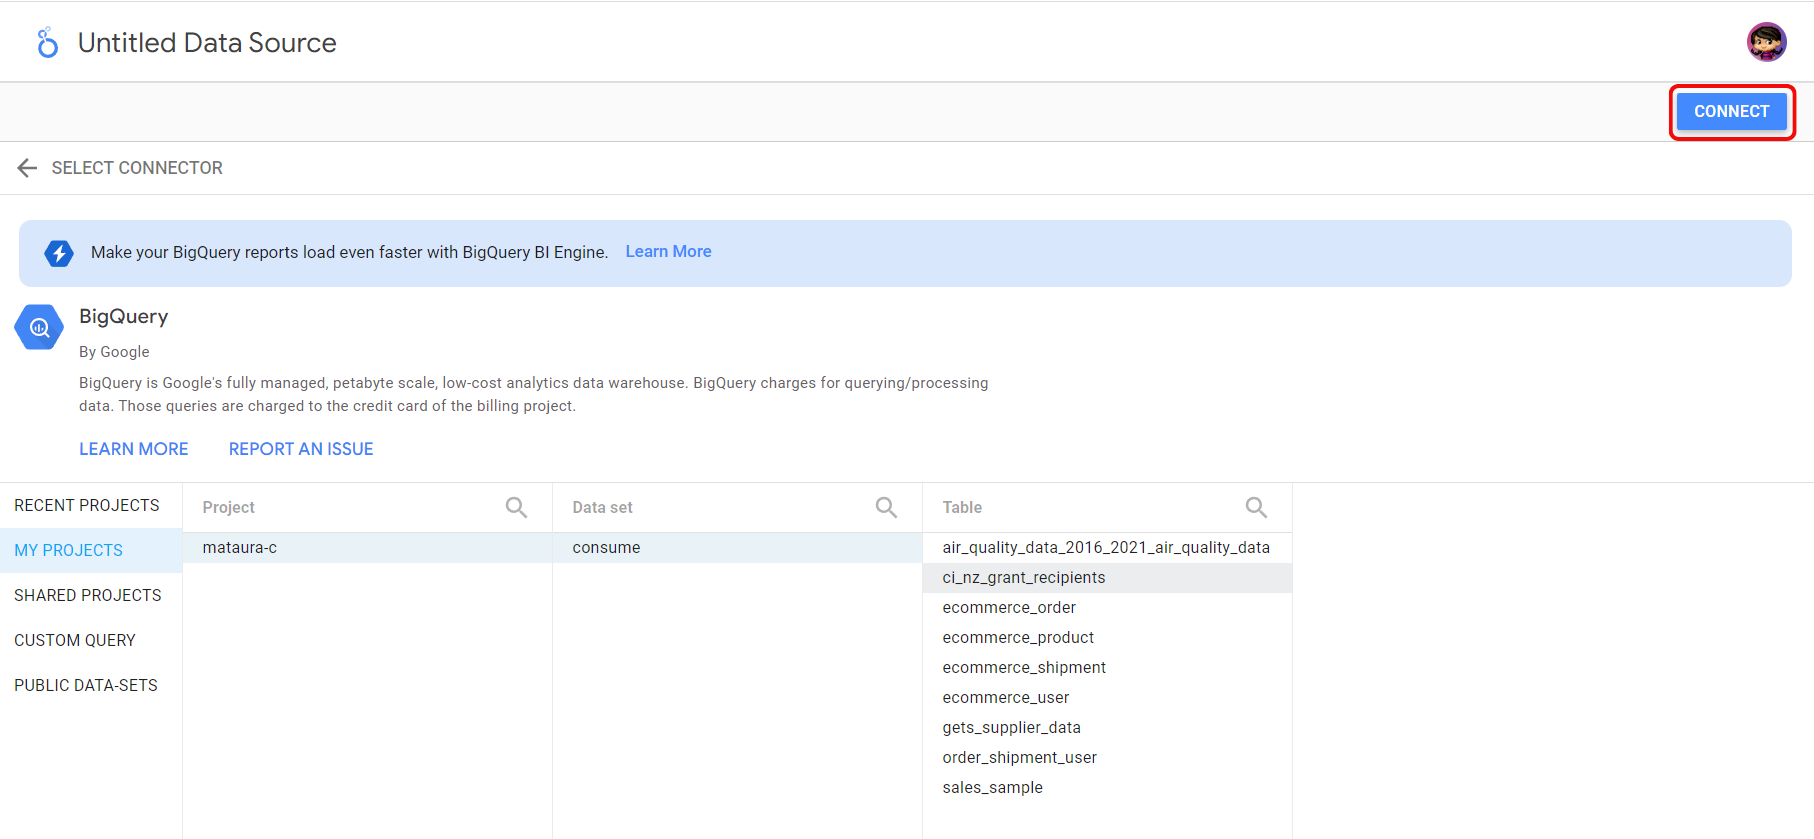
If you are using the Google Account which is associated with your AgileData account, you will see a project that is labelled with a similar name as your AgileData Tenancy in My Projects. Click on the project to proceed.

Choose “Consume” in the list of datasets. Now you see a list of tables which is corresponding with all the Consume Tiles from the catalog in the AgileData App. Select the Consume Tile you would like to analyse.
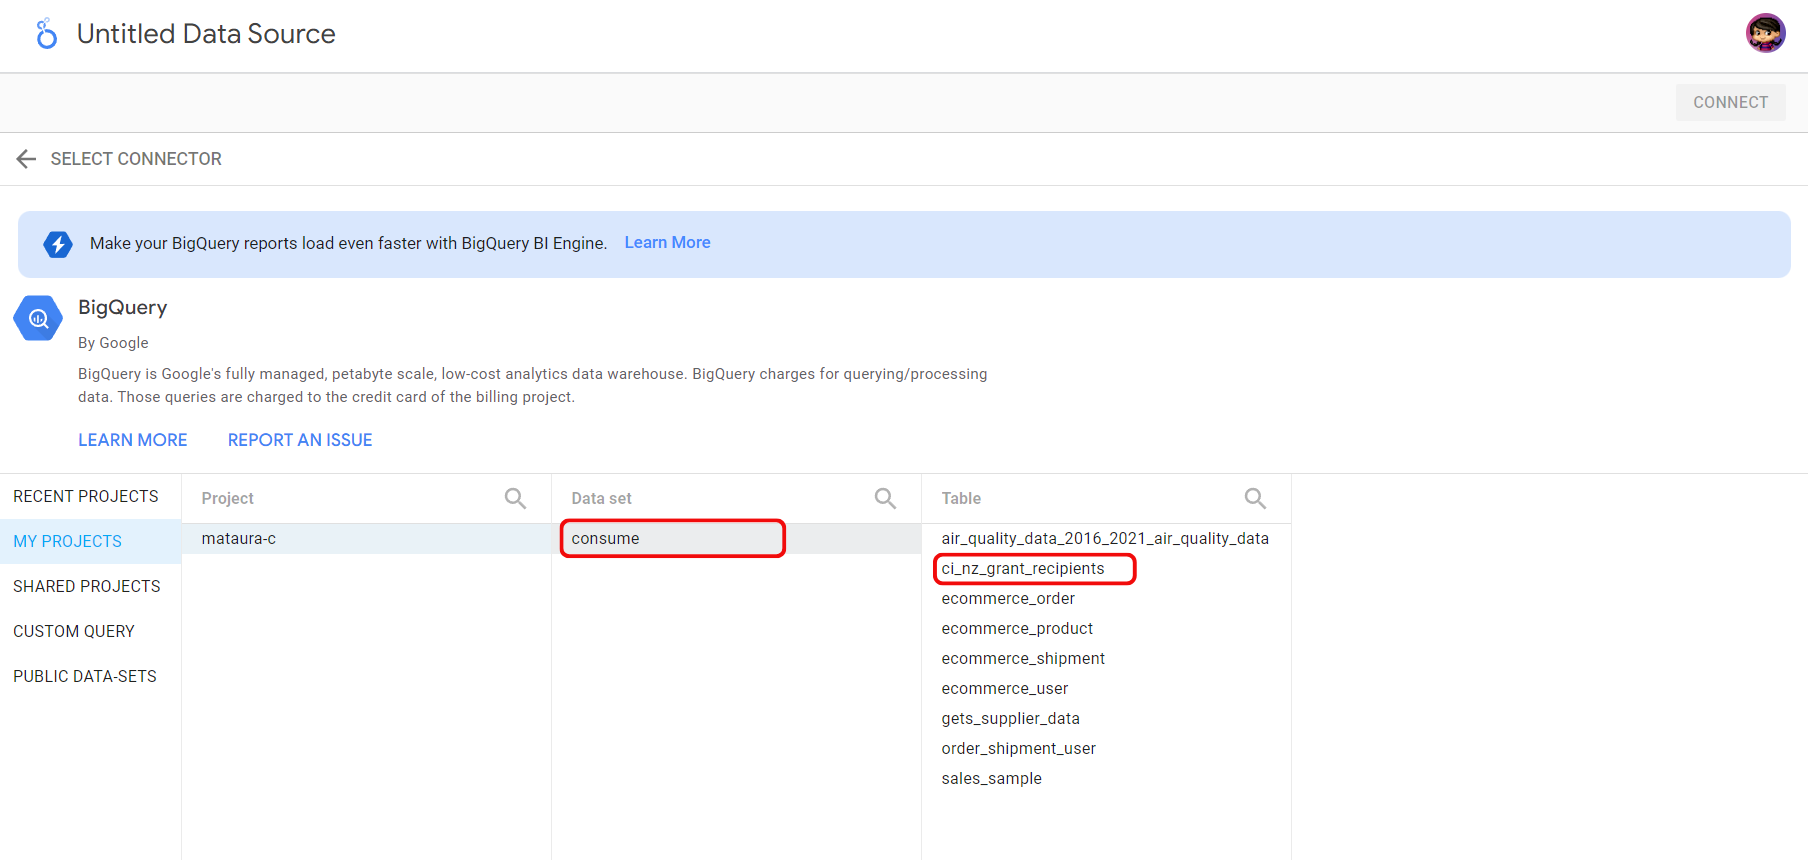
Click on the “Connect” button in the top right corner of the screen.
Now Looker Studio will pass your credentials to BigQuery, authenticate you with the AgileData App and query all of the fields from the Consume Tile you specified.
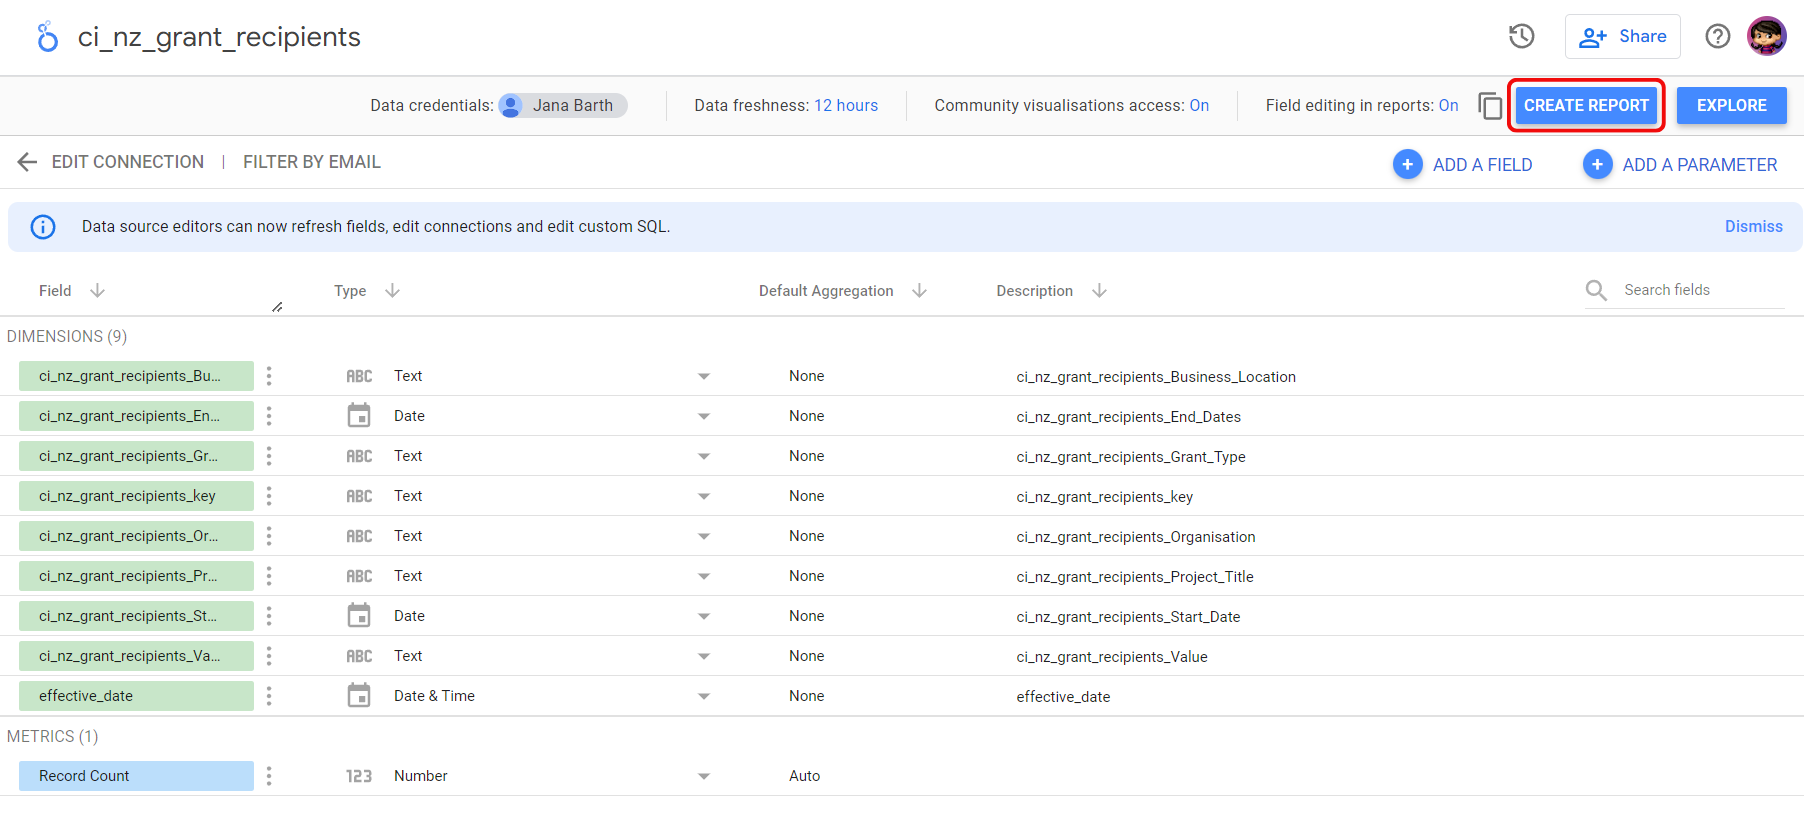
A new screen will open, showing all of the fields from the Consume Tile.
You can rename any of the fields by clicking on the field name. You also can see the data type of the fields and an automatically generated description.

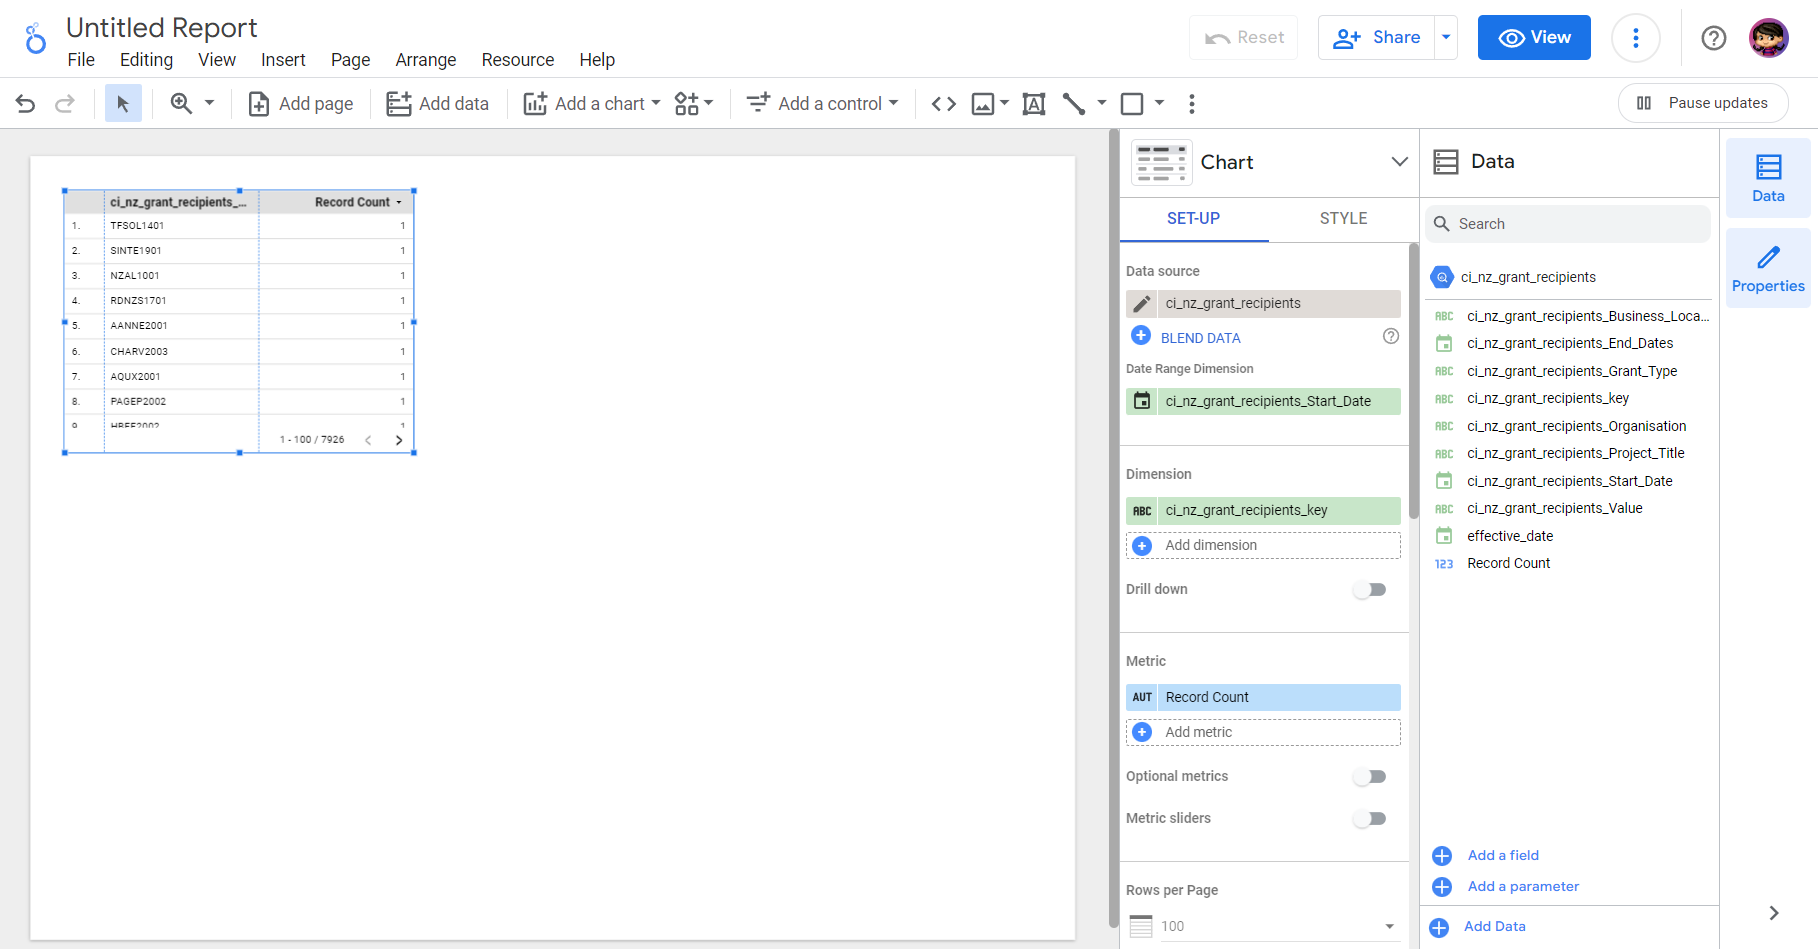
5. Create report with data from Consume Tile
Click on the “Create Report” button in the top right corner of the screen. The data will get opened in a report in Looker Studio in a new tab.
Confirm that you want to add the data from the Consume Tile to the report by clicking on “Add To Report”.
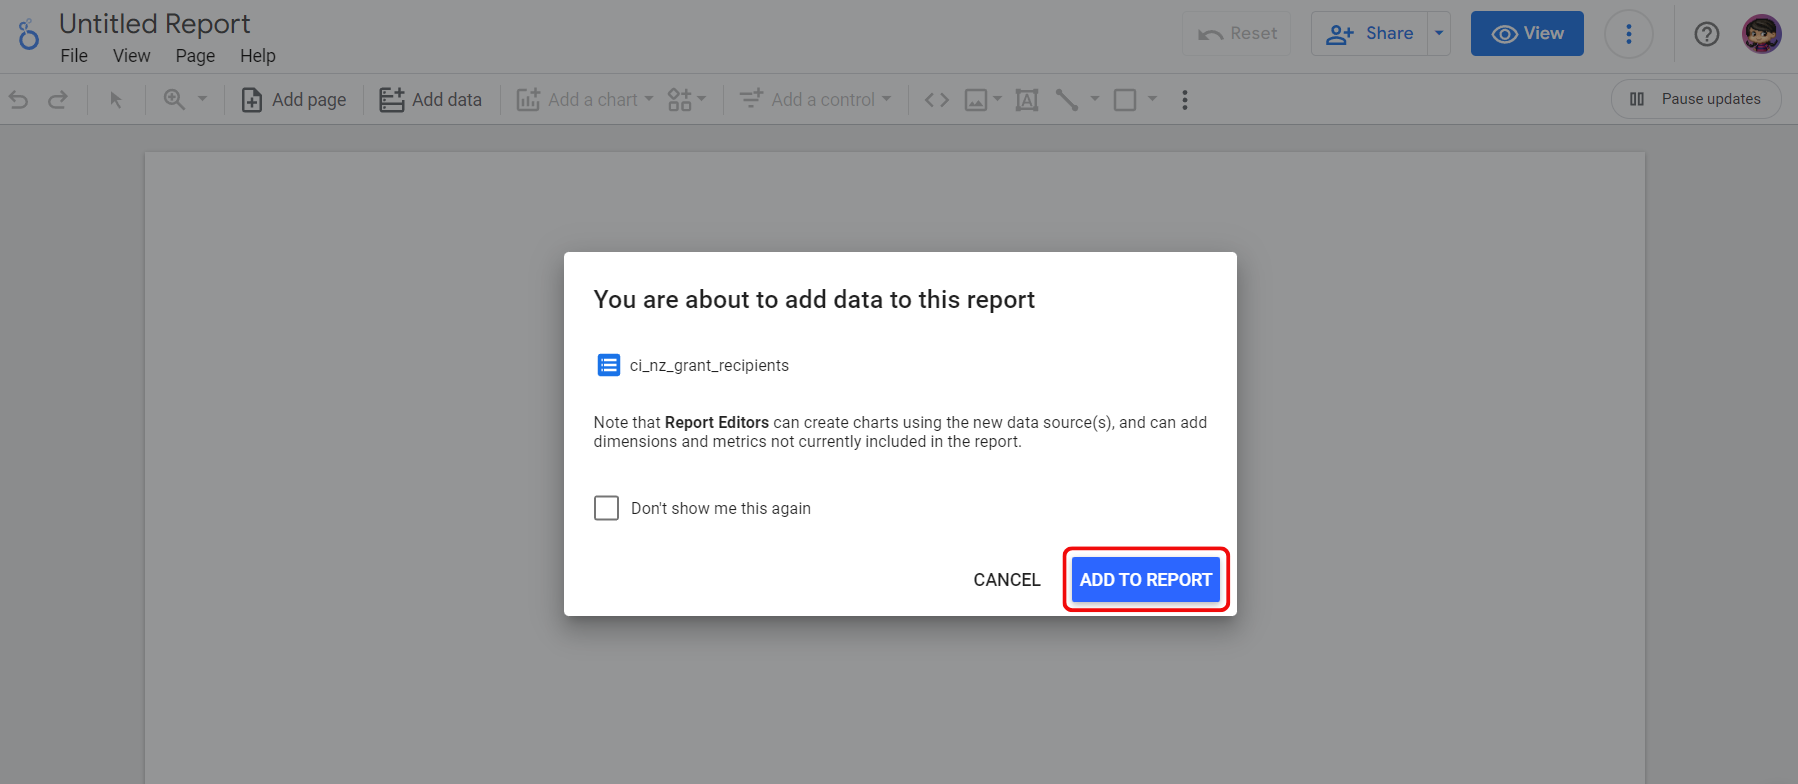
Now you are ready to write and design your report in Looker Studio. You can add tables, charts and text fields as required. Every time you reopen your report, the Consume Tile will get queried again, refreshing the data.